Visualizing Palestine shows why infographics matter in revealing the reality of Israel’s oppression of Palestinians
Visualizing Palestine shows why infographics matter in revealing the reality of Israel’s oppression of Palestinians
Book Club: The 'Visualizing Palestine' book uses striking infographics to reveal the history, as well as the ongoing struggle and displacement of Palestinians
4 min read
The movement for Palestinian liberation is growing more organised and impactful, but we also see conditions on the ground worsening for Palestinians.
Israel’s genocidal war on Gaza has seen some of the worst suffering in Palestinian history but has also seen some of the most extraordinary solidarity with the cause for Palestinian freedom.
There are many worthwhile media, books, projects, lectures and films exploring the reality of Israel’s oppression of Palestinians.
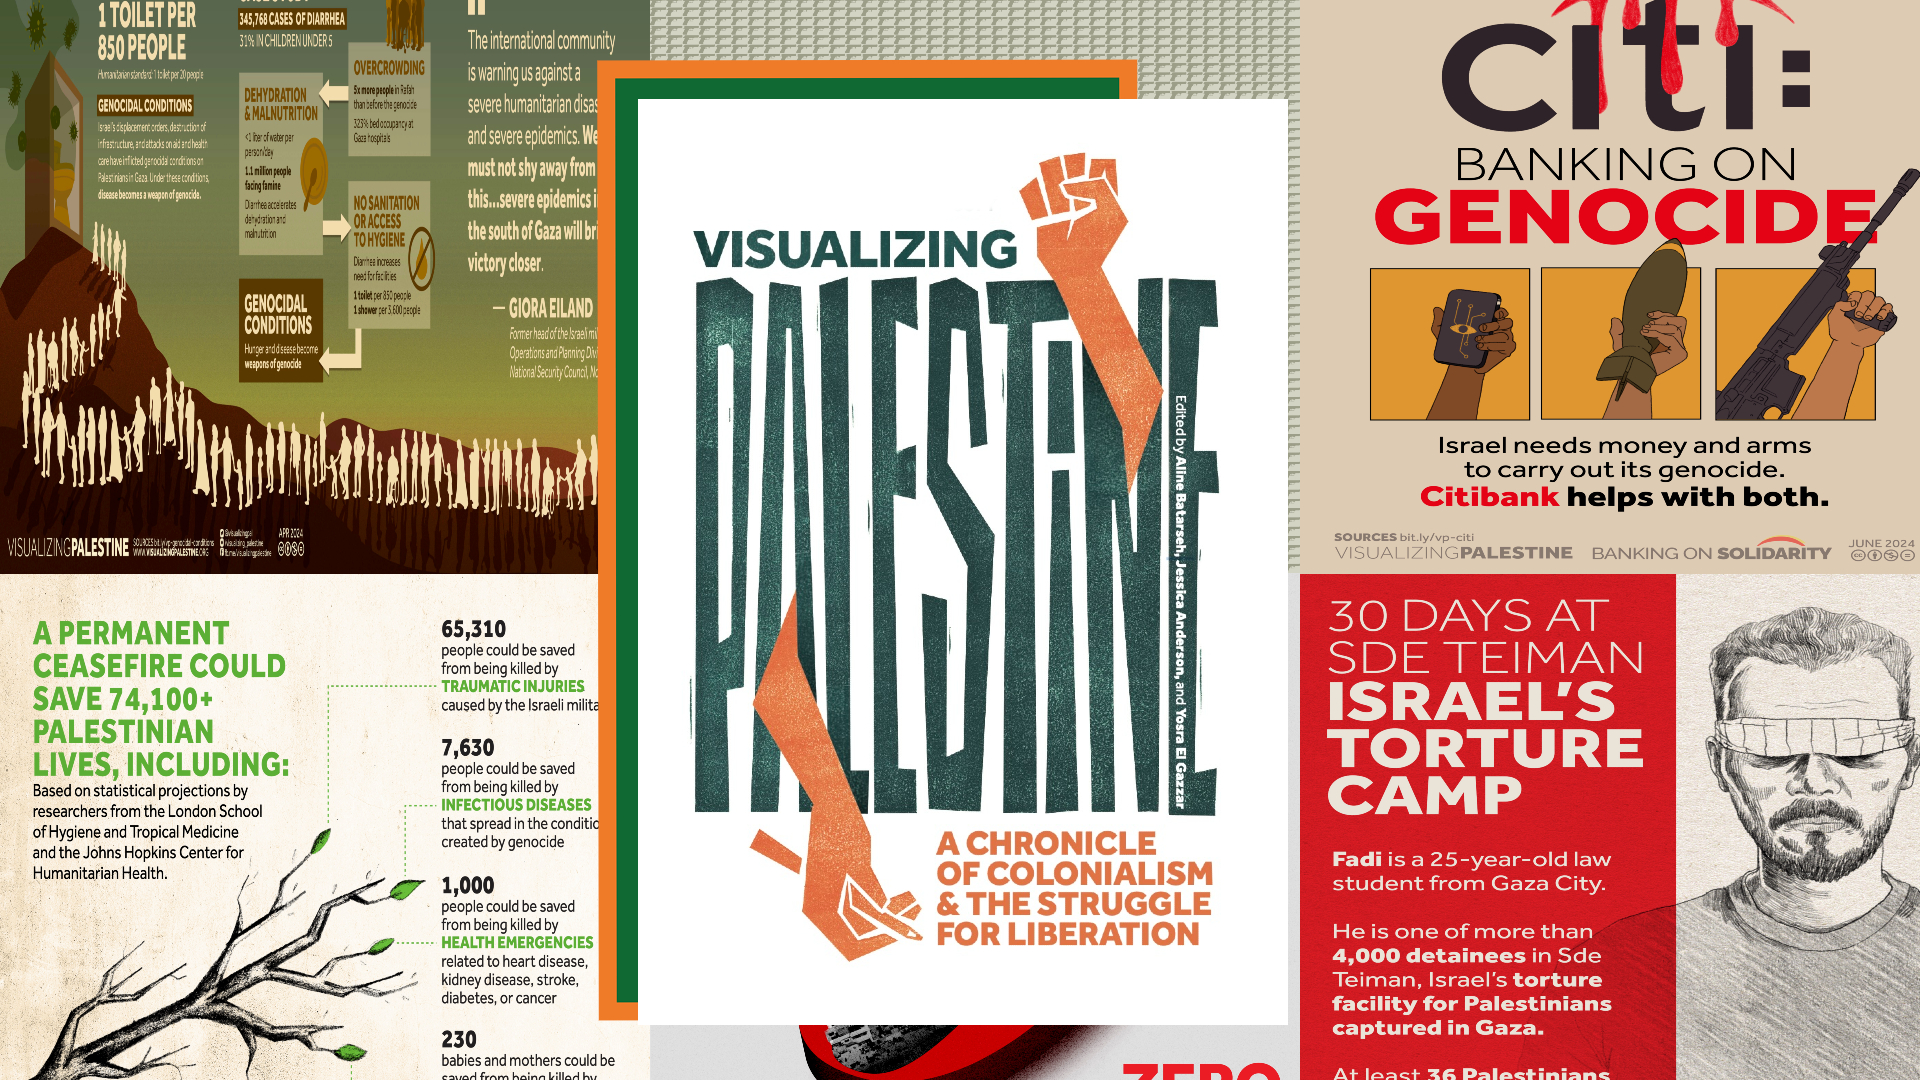
Visualizing Palestine: A Chronicle of Colonialism and the Struggle for Liberation is part of that effort and a valuable resource in that struggle.
Developed by the data and research organisation of the same name and edited by Jessica Anderson, Aline Batarseh, and Yosra El Gazzar, it brings together over 200 vivid, full-colour infographics depicting in detail the conditions of occupation, oppression, and resistance.
Set to release in September, Visualizing Palestine is perhaps one of the most effective ways to show how Israel’s war on Palestine and Palestinians did not begin on October 7 2023 nor with Israeli Prime Minister Benjamin Netanyahu and his right-wing coalition.
Infographics, which take data and produce images and visual representations of that data, leave little room for doubt about events unfolding on the ground.
Maps of dispossession
"The Palestinian people’s right to freedom is no more or less complicated than any other people’s. We trace the roots of the Palestinian struggle to European colonialism, which is responsible for settler colonial projects in Canada, the United States, Australia, New Zealand, South Africa, Palestine, and other territories"
Visualizing Palestine features several interesting infographics including images and interactive graphics on settler colonialism, the ongoing Nakba, apartheid, Gaza, ecology, political prisoners, US involvement and BDS.
Data can communicate historical reality in interesting ways, especially when combined with imagery and Visualizing Palestine’s work on settler colonialism best illustrates this.
The maps are perhaps my favourite data visualisation projects Visualizing Palestine has undertaken.
In the interactive Palestine Shrinking, Expanding Israel map, we can see the gradual transformation of historic Palestine into 'Greater' Israel through four different maps of Palestine.
The first is in 1918 after the Balfour Declaration was issued, the second in 1947, the third in 1960 and the last one is from 2017 with the colour turquoise representing the Palestinian-owned land and the black being the Zionist Jewish settler's land.
In the 1918 map, nearly the entire map is turquoise with only a handful of black dots. More intriguingly, in the 1947 map, which is one year before Britain leaves Palestine and the Nakba begins, the black coloured areas have increased but still, only take over a tiny proportion of the land with the overwhelming majority remaining turquoise.
By 1960 the colour of the map changes massively with black coloured areas being greater in size, with this difference increasing drastically more by 2017.
A simple comparative image like this gets across the scale of Palestinian disposition, expulsion and ethnic cleansing over history, in a way that is easy to understand and distribute.
"We adapted Palestine Shrinking, Expanding Israel from a series of maps activists have used for decades to show how Israeli rule has confined Palestinians to ever-diminishing fragments of their land. These maps communicate that domination over land"
Confronting imagery
The imagery can also be haunting at times.
The 2017 infographic on Shuhada Street: How Israel Turned Hebron into a Ghost Town in Hebron has a series of data points, showing that in 1997 all Palestinians were denied access to the street, while Israeli settlers continued to have access to it.

Year: 2017 | Brief and copywriting: Marianna Castellari, Peige Desjarlais, Abeera Khan | Design: Yosra El Gazzar
Other data points connected to the city centre of Hebron showed that between 2000-2006 there was a 50% drop in school attendance, in 2007, 304 Palestinian shops and warehouses were closed while 40% of homes were forcibly emptied.
The imagery turns remote, analytical and dispassionate data from Hebron into an emotional and instinctual reaction.
You understand the data as representing something more than just numbers, it shows what apartheid looks like and how it has unfolded.
Remembering the journey to justice
So why read Visualizing Palestine and why does creating infographics matter?
Perhaps the use of infographics — which takes data and converts it into compelling visuals — not only makes data comprehensive to non-data nerds, it also communicates the progress of the destruction of Palestine since 1948 in a concise and much easier way than reading dense history books, political science papers and news articles.
The data collected and published in Visualizing Palestine is useful to experts and non-experts alike and enables the reader to see and understand the war on Palestine over the decades and as it currently unfolds.
Visualizing Palestine is a necessary, attractive, colourful, visually stunning, confronting and compelling read that not only chronicles the organisation's work but also demonstrates the different avenues that can enable the Palestinians' quest for freedom, dignity and justice.
‘For all Palestinians, past, present, and future may these visuals one day be artefacts for free generations to remember the journey to justice.’
Usman Butt is a multimedia television researcher, filmmaker and writer based in London who read International Relations and Arabic Language at the University of Westminster and completed a Master of Arts in Palestine Studies at the University of Exeter

![Activists arrested while protesting US military support for Israel. [Photo by Kristine Jones, courtesy of Adalah Justice Project]](/sites/default/files/styles/image_684x385/public/2024-11/Photo%20Credit%20Kristine%20Jones%20-%20Arrests.JPG?h=2142ea21&itok=-zJER9f0)
 Follow the Middle East's top stories in English at The New Arab on Google News


